Table of Contents:
- QBiC-Pred input
- TF binding models
- QBiC-Pred output
- QBiC-Pred 12-mer encoding
- Software for model training and prediction
1. QBiC-Pred input
The main input file for QBiC-Pred must be a text file containing variants/ mutations in one of the following formats:
-
VCF format (download sample file)
Each line has at least 5 tab-separated fields.
Column 1: chromosome name (hg19 or hg38)
Column 2: position (hg19 or hg38); must be a positive integer within chromosome length
Column 3: variant name; this field can be left empty
Column 4: reference allele; must be a single upper or lower case nucleotide letter
Column 5: alternative allele; must be a single upper or lower case nucleotide letter
(future QBiC releases will also allow short indels and multiple base substitutions)
chr1 48473010 . A G chr2 97536853 . C T chr3 181842690 . G A chr5 54469459 . C G -
ICGC simple somatic mutation file (download sample file).
Please see the ICGC guidelines for details about this tab-separated file format. The columns used by QBiC-Pred are: chromosome, chromosome_start, chromosome_end (which must be the same as chromosome_start for single nucleotide variants), mutation_type (QBiC-Pred will only use variants with this field set to “single base substitution”), mutated_from_allele, and mutated_to_allele.... chromosome chromosome_start chromosome_end ... mutation_type ... mutated_from_allele mutated_to_allele ... 6 65152140 65152140 ... single base substitution ... T C ... 8 108596584 108596584 ... single base substitution ... T C ... 15 34737692 34737692 ... single base substitution ... A C ... 9 84841627 84841627 ... single base substitution ... C G -
Any tsv (tab-separated values) or csv (comma-separated values) file with the following columns: chromosome, chromosome_pos, mutated_from, mutated_to (download sample file).
chromosome chromosome_pos mutated_from mutated_to 6 65152140 T C 8 108596584 T C 15 34737692 A C 9 84841627 C G -
Text file that contains 17-mer DNA sequences with the "mutated from" nucleotide in the middle and the "mutated to" nucleotide on the right, separated by a space or tab character. Text file that contains 17-mer DNA sequences with the "mutated from" nucleotide in the middle and the "mutated to" nucleotide on the right, separated by a space or tab character (download sample file).
CAGAGAATTGTAGAACT C CCCCACGATATTGTGTG A ATGAAAAAAAAAATGAG C AATGTTCTCCCATTCTG G
QBiC-Pred will process each input file to extract the genomic sequence contexts for all variants (please ensure that the correct version of the genome is selected on the “Make Predictions” page."). The extracted sequence context will be visible to the user when the output results are displayed.
The input file size is currently limited to 100MB since each file is processed on our server. Since QBiC makes predictions for single nucleotide variants, if the user has rows containing other type of variants, we recommend filtering them out in order to allow more rows with single nucleotide variants to be processed. Also, for large jobs containing a large number of variants, the user can check the status of the job by using the  button on the upper right corner of any QBiC page. The jobs have unique identifiers and they are stored on the QBiC-Pred server for 48 hours. The job page can be bookmarked for later visits.
If users want to open a job in a browser different from the one they used to submit the job, they can use the direct link: http://qbic.genome.duke.edu/process/<job_id>.
Other required input fields:
-
TF proteins to be tested.. The user can select either entire families of TFs (see Select TFs by families), or individual TFs by using Select transcription factors: or by providing an input file with TF gene names (see upload a TF file).
Individual TFs, as well as TF families, are searchable by the user:


QBiC-Pred uses the HGNC nomenclature for gene names. A full list of TF gene names for which QBiC-Pred contains predictive models is available here. In case the user provides a file containing gene names not recognized by QBiC-Pred, or for which we do not current have predictive models, an error message will alert the user:

-
Human genome version to be used (default: hg19).
-
Desired output for the QBiC-Pred results, which can be either:
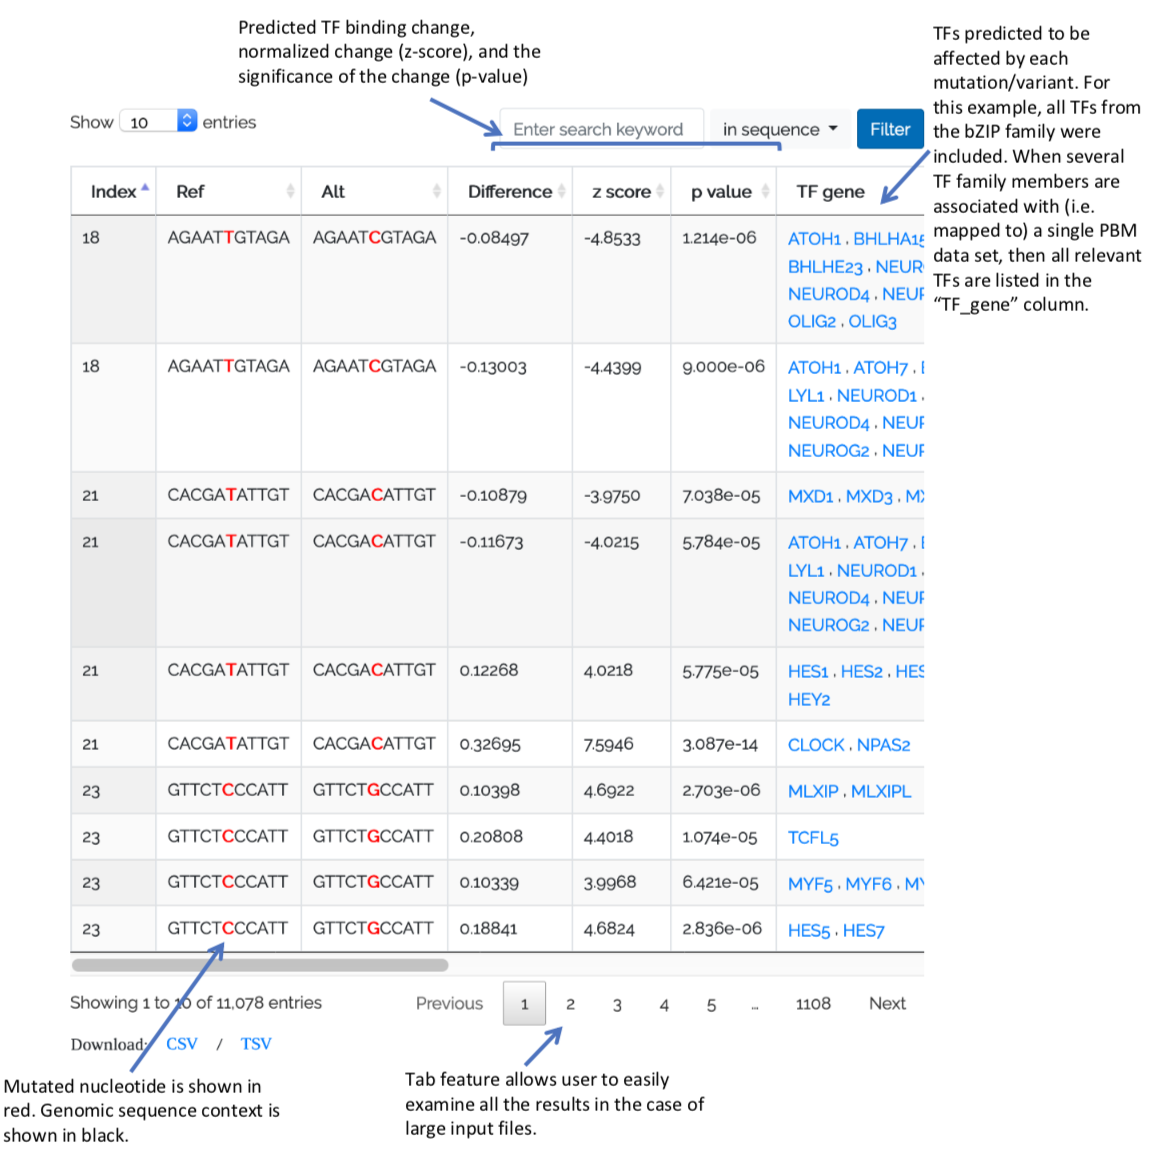
- p-value threshold (default option). In this case QBiC-Pred will return, for each input variant, all input TFs predicted to be affected by that variant at a significance (p-value) of less than the value set by the user (default 0.0001). Predictions of both increased and decreased TF binding will be returned.
- largest absolute z-score. In this case QBiC-Pred will return, for each input variant, the input TF (or the top 2 or 3 input TFs) for which the variant has the largest effect (i.e. largest z-score in absolute value). Z-scores represent normalized binding changes, and thus they are comparable among TFs. Positive z-scores reflect increased TF binding due to the variant. Negative z-scores reflect decreased binding.
2. TF binding models
QBiC predictions are based on quantitative TF binding models trained on universal protein binding microarray (PBM) data from the following databases:
- UniPROBE: http://thebrain.bwh.harvard.edu/uniprobe/
- CisBP: http://cisbp.ccbr.utoronto.ca/
- PBM data generated in the Gordan laboratory (reported in Shen et al. Cell Systems 2018, or included with the release of QBiC)
We downloaded the entire database from CisBP (v1.02) consisting of 3,342 universal PBM data sets. Next, we added 245 PBM data sets from the UniPROBE database, which were not included in CisBP, and 22 PBM data sets generated in our lab, resulting in a total of 3,609 PBM data sets. Then we annotated the quality of each uPBM data based on: 1) the number of 8-mers with binding enrichment score (E-scores) exceeding 0.45; and 2) the performance of our models trained on the data, which enabled us to filter out low quality PBM data sets. After the filtering process, we utilized The Human Transcription Factors Project, as well as manual curation, to map PBM data sets to human TFs. By keeping only the best quality or the highest amino-acid identity PBM data sets for each TF, we finally arrived at a total of 666 data sets characterizing the binding of 582 human TFs. The full mapping of human TFs to available PBM data sets is available here.
Each of the 582 TFs used by QBiC-Pred has up to 6 PBM datasets mapped to it: the top 1-3 data sets for which the tested TF has the largest amino-acid identify to the human TF, and the top 1-3 data sets for which the OLS models have the highest cross-validation accuracy. Complete information on the cross-validation accuracy and the amino-acid identity is available here. When the user selects a particular TF as input, OLS models trained on all PBM datasets mapped to that TF are used for predictions. After the predictions are returned, users can post-process the results to focus on particular models/PBM datasets of interest.
Our TF binding models are linear regression models trained on universal PBM data. We use the counts of 6-mers as features, and the binding intensity signal as the outcome variable. Then, we use ordinary least squares (OLS) to estimate the coefficients for all 6-mer features, as well as the distributions of these estimates. The effect of each mutation can be written as a linear combination of all the coefficients of 6-mers covering it and can therefore be estimated as well as tested for statistical significance, as described in detail in our previous work. Thus, for each variant and each PBM data set for a TF protein, our model predicts:
- Difference = the difference in TF binding (i.e. in PBM signal) between the two alleles
- z-score = the normalized difference in TF binding, computed based on the estimated parameter distributions; the z-scores are comparable among different TFs and data sets
- p-value = the significance of the predicted difference, computed based on the estimated parameter distributions; the p-values depend on the magnitude of difference, as well as the quality of the model and the training data.
3. QBiC-Pred output
QBiC-Pred reports results in the form of a table that the user can explore and interact with:
In addition to reporting the TF(s) affected by each variant, QBiC provides information about the status of each allele, which can be “bound”, “unbound”, or “ambiguous”. This status is derived from the same PBM data sets used to train the OLS binding models. But, unlike the OLS model, defining the status of an allele is based on 8-mer enrichment scores (E-scores) commonly derived from PBM data (see, Berger et al. Nature Biotech, 2006; Shen et al. Cell Systems 2018). As in our previous work, we define an allele as specifically “bound” if it is contained in two overlapping 8-mers with E-score > 0.4. Conversely, we define an allele as “unbound” if all 8-mers overlapping the allele have E-score < 0.35. All other cases are considered “ambiguous”. These values however, can be adjusted by using the "Advanced options" dropdown from the "Make Predictions" page.
QBiC provides this information to allow users to focus only on prediction that are of most interest to them, e.g. from “unbound” for the reference allele to “bound” for the alternative allele (“unbound>bound” in the “Binding status” column). The users can easily filter the results by clicking on values in the “Binding status” column:

Filters can be set in a similar manner for TF names, models, and PBM data sets. For example:

For PBM data sets (column PBM filename), the QBiC output table also provides an option to directly download the data and the model used to make the predictions.
Additional output processing options include filtering by p-value, z-score, sequence, or TF name using the “Search” functionality:

For example, if the user is interested in visualizing only predictions with large increases in TF binding, he/she can set minimum z-score value such as depicted below:

At any point during the visualization and processing of the QBiC-Pred results, users can download the current results in comma delimited format using download csv/tsv link below the table. The downloaded results can be uploaded back into QBiC-Pred at any time for further processing and filtering, using the “Upload Result” page:

This uploaded data will be saved for 24 hours, after which the user can upload the result file again in order to use the website interface to explore the results.
4. QBiC-Pred 12-mer encoding
In order to make fast predictions of the impact of single nucleotide variants/mutation on TF binding, QBiC performs table lookup in pre-computed prediction files covering all possible mutations in all possible contexts. Each lookup table coresponds to one OLS model, and it contains information on the binding change ("difference") and the test statistic ("z-score") for each possible mutation. For a detailed explanation of how these values are calculated, please refer to section 2.3 to 2.5 from the original paper original paper .
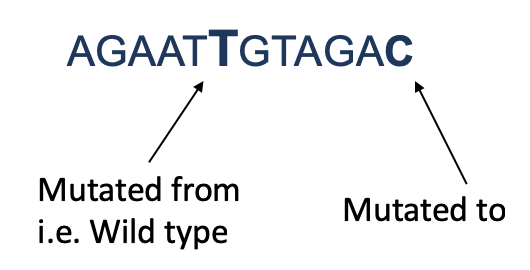
We refer to the pre-computed files as 12-mer files. Each row in a 12-mer file corresponds to an 11-bp DNA sequence for which the middle nucleotide is mutated:

We use the wild-type and mutated 11-mer sequences to generate a 12-mer by adding the "mutated_to" nucleotide at the end of the wild-type sequence:
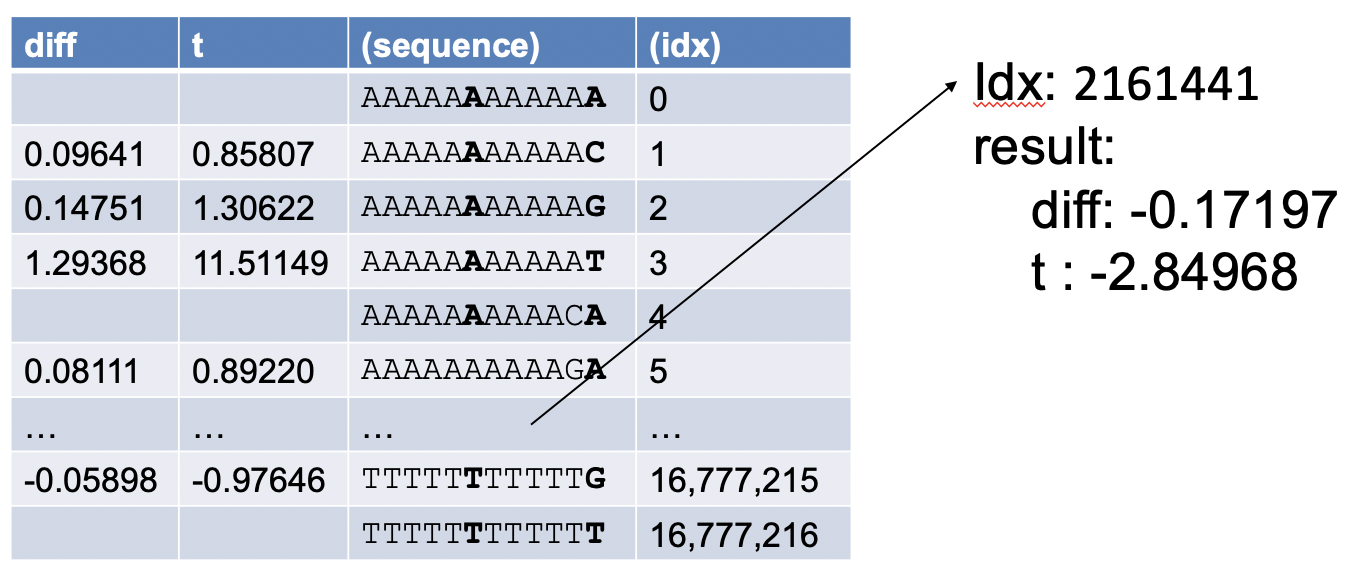
Next, we use a binary encoding of the nucleotides (A=00, C=01, G=10, T=11) to transform each 12-mer into an integer index. The 12-mer sequences and integer indices are not explicitely stored in the 12-mer files. Instead, we use the computed index for a 12-mer sequence to access the corresponding row in a 12-mer file where the predicted binding difference and z-score are stored:

For example, for the 12-mer sequence shown above (AGAATTGTAGAC) the integer index is 2161441.
After extracting the difference and z-score, we use the z-score to compute the statistical significance of the change (i.e. p-value). For convenience, the 12-mer tables containing binding differences and z-scores, as well as tables containing the corresponding p-values, are available for download from the Download page. The pre-computed files are organized into 14 zip files, each containg predictions from 50 OLS models. A mapping between the OLS models and the zip files is available here.
5. Software for model training and prediction
Python code for making predictions using our OLS models is available in the QBiC-Pred GitHub repository, at: https://github.com/vincentiusmartin/QBiC-Pred/tree/master/generate_predictionPython code for training OLS models on uPBM data is available in the QBiC-Pred GitHub repository, at: https://github.com/vincentiusmartin/QBiC-Pred/blob/master/generate_prediction/olskmer.py
To run the training script please use:
python olskmer.py <filein> <output> -k <kmer> -d <chunk> -g <gapsize> -p <gappos>
where:
output = the name of the output file
kmer = the size of k-mers used in the OLS model
chunk = div is the number of chunks required when the data is too large to be processed at once
gapsize = the size of the gap, for OLS models using gapped k-mer (set to 0 for ungapped models, which are the type of model used by QBiC)
gappos = the position of the gap within the k-mer